Women in Philosophy:
Quantitative Analyses of Specialization, Prevalence, Visibility, and Generational Change
Eric Schwitzgebel
Department of Philosophy
University of California at Riverside
Riverside, CA 92521-0201
eschwitz at domain ucr.edu
Carolyn Dicey Jennings
School of Social Sciences and Humanities
University of California at Merced
Merced, CA 95343
cjennings3 at domain ucmerced.edu
July 19, 2016
Women in Philosophy:
Quantitative Analyses of Specialization, Prevalence, Visibility, and Generational Change
Abstract:
We present several quantitative analyses of the prevalence and visibility of women in moral, political, and social philosophy compared to other areas of philosophy, and of how the situation has changed over time. Measures include faculty lists from the Philosophical Gourmet Report, PhD job placement data from the Academic Placement Data and Analysis project, the National Science Foundation’s Survey of Earned Doctorates, conference programs of the American Philosophical Association, authorship in elite philosophy journals, citation in the Stanford Encyclopedia of Philosophy, and extended discussion in abstracts from the Philosopher’s Index. Our data strongly support three conclusions: (1) Gender disparity remains large in mainstream Anglophone philosophy; (2) ethics, construed broadly to include social and political philosophy, is closer to gender parity than are other fields in philosophy; and (3) women’s involvement in philosophy has increased since the 1970s. However, by most measures, women’s involvement and visibility in mainstream Anglophone philosophy has increased only slowly; and by some measures there has been virtually no gain since the 1990s. We find mixed evidence on the question of whether gender disparity is even more pronounced at the highest level of visibility or prestige than at more moderate levels of visibility or prestige.
Word Count: 8977 words, plus 6 tables and 3 graphs
Women in Philosophy:
Quantitative Analyses of Specialization, Prevalence, Visibility, and Generational Change
1. Introduction.
Women are half of the population, but they do not occupy half of all full-time university faculty positions, publish half of all academic journal articles, nor constitute half of the highest social status members of academia.[1] The last several decades have seen substantial progress toward gender parity in most disciplines, but philosophy remains strikingly imbalanced in faculty ratios and in citation patterns in leading philosophical journals.[2] The persistent gender imbalance in philosophy is particularly noteworthy because (a) feminism is an important subfield within philosophy and many philosophers explicitly identify as feminist, suggesting that the discipline ought to be a leader rather than a laggard in addressing gender issues; (b) most of the humanities and social sciences have shifted much closer toward parity than has philosophy, leaving philosophy with gender ratios more characteristic of disciplines superficially very different, such as engineering and the physical sciences; and (c) some measures suggest that progress toward gender parity in philosophy has stopped or slowed since the 1990s.[3]
Previous work in the sociology of academia suggests that gender ratios differ substantially between subfields within academic disciplines, possibly with women more common in subfields regarded as less prestigious.[4] Preliminary data suggest that moral, political, and social philosophy might be closer to gender parity than other areas of philosophy, and many of the most prominent women philosophers of the past hundred years have been known primarily for their work in these areas (e.g. Simone de Beauvoir, Hannah Arendt, Philippa Foot, Martha Nussbaum, and Christine Korsgaard).[5]
Below we present data from several sources on the prevalence and visibility of women in philosophy over the past several decades. We focus on philosophy in the English-speaking world, especially the United States. There is, we believe, a sociological center of dominance in philosophy as practiced at universities in the United States, the United Kingdom, Canada, and Australia. We will call this sociological center mainstream Anglophone philosophy, without intending any judgments about the quality of mainstream Anglophone philosophical work compared to work in other languages or traditions or outside of this sociologically defined mainstream. Visibility in mainstream Anglophone philosophy can be measured in a variety of ways, capturing different phenomena. Among the measures we use are membership in highly ranked departments in the Philosophical Gourmet Report; publication in and citation in journals that are viewed as “top” journals (e.g. Philosophical Review and Ethics, which tend to lead journal-ranking polls on Anglophone philosophy blogs); invited presentation at meetings of the American Philosophical Association; and citation in the Stanford Encyclopedia of Philosophy.
We aim to test four hypotheses:
(1) Confirming other recent work, gender disparity remains large in mainstream Anglophone philosophy, across several methods of measuring women’s involvement or visibility.
(2) Ethics, construed broadly to include moral, political, and social philosophy, is closer to gender parity than are other areas of philosophy.
(3) The gender disparity in mainstream Anglophone philosophy is even more pronounced at the highest levels of visibility or prestige than at moderate levels of visibility or prestige.
(4) Women’s involvement and visibility in mainstream Anglophone philosophy has increased over time, but only slowly in the past few decades.[6]
2. Analysis of the 2014 Philosophical Gourmet Report.
The Philosophical Gourmet Report (PGR), which in 2014 was edited by Brian Leiter and Berit Brogaard, is a survey of philosophy faculty quality or reputation. Every few years hundreds of “research active” philosophers are asked to numerically rate overall faculty quality at dozens of PhD programs – programs that in the view of the editorial board stand a reasonable chance of being among the top 50 in the U.S., the top 15 in Britain, the top 5 in Canada, or the top 5 in Australasia. These numerical ratings are averaged to create overall rankings.[7]
We examined the faculty lists provided to the PGR evaluators in 2014 for all departments in the United States (59 total departments), removing from the list faculty listed as “cognate” or “part-time.” Subfield was determined by area of specialization information available on department or faculty websites and sorted into four categories: “Value Theory”, “Language, Epistemology, Metaphysics, and Mind” (LEMM), “History and Traditions”, and “Science, Logic, and Math”. These categories were chosen using a taxonomy created by the PhilPapers Categorization Project (combining the categories of “History of Western Philosophy” and “Philosophical Traditions” into “History and Traditions”), and areas of specialization were fit into subfields based on that taxonomy.[8] Faculty whose work crossed subfields were classified based on their first-listed area of specialization. Gender was classified based on name, website photo, and personal knowledge. In no case was gender judged to be non-binary or indeterminable.
Of the 1104 analyzed faculty, 25% (271) were women, a number roughly consistent with previous estimates that women are between 19% and 26% of U.S. faculty in philosophy overall (see footnote 2; the statistical 95% confidence interval (CI) around 271/1104 is 22% to 27%).[9] If we confine the analysis to the 258 faculty at the top twelve[10] rated universities according to the 2014 PGR, the percentage of women is 24% (61/258; CI 19% to 29%). Using the two-proportion z test[11], we found that the difference between the proportion of women in the top twelve programs and the proportion of women in the other forty-seven programs was not statistically significant (z = 0.4, p =.70). [12],[13]
To test whether the distribution across subfields is different for women versus men in the full set of faculty, we used the chi-squared test for multiple proportions, which in this case compared the actual distribution of women and men in these subfields to an “expected” distribution in which there is no gender difference. We found that the distribution of women and men across different subfields, shown in Table 1, was indeed statistically significantly different from this expected distribution (χ2 [3] = 31.0, p < .001).[14]
Table 1: Percentage of faculty in each subfield who are women, among PGR-rated faculty in the United States in 2014.
Subfield # women # men % women
Value Theory 90 176 34%
Language, Epistemology, Mind, and Metaphysics 65 266 20%
History and Traditions 78 185 30%
Science, Logic, and Math 38 206 16%
Value theorists constituted 22% (56/258) of faculty at the top-twelve rated universities and 25% (210/846) of faculty at the remaining universities, a difference in proportion that was not statistically significant (z = -1.0, p = .31). The mean PGR rating was 3.02 for faculty in the Value Theory subfield and 3.12 for faculty in all other subfields – a statistically marginal trend using Student’s t-test for comparing two means (t = -1.9, p = .06).[15]
Table 2 displays the data by academic rank. To test whether the distribution across academic ranks is different for women versus men in the full set of faculty, we compared the actual distribution of women and men in these academic ranks to an “expected” distribution in which there is no gender difference. The difference in distribution was highly statistically significant (χ2 [2] = 23.1, p < .001), with a higher proportion of women at the rank of assistant and associate professor than at the rank of full professor. The trend was evident both in Value Theory (43% women among faculty at assistant rank, 55% among faculty at associate, 26% among faculty at full) and in all other subfields combined (36%, 22%, 18%).
Table 2: Percentage of faculty at each professional rank who are women, among PGR-rated faculty in 2014.
Rank # women # men % women
Assistant professor 58 97 37%
Associate professor 72 180 29%
Full professor 141 556 20%
These data thus support Hypothesis 1: At 25% women faculty, gender disparity among faculty at PGR-rated U.S. PhD programs is large and approximately in line with previous estimates. Hypothesis 2 is also supported: Women were not proportionately represented among the subfields, with the highest proportion in Value Theory (34%) and the lowest proportion in Science, Logic, and Math (16%). Hypothesis 3, however, is not supported: 2014 PGR-rated PhD programs in the United States do not appear to contain a lower percentage of women than U.S. faculty as a whole, nor did we find evidence that the top twelve programs have a significantly smaller proportion of women than the other rated programs. The difference in distribution between men and women with respect to professional rank is consistent with an increase in women recently entering the faculty (Hypothesis 4) but is also consistent with higher attrition rates, lower promotion rates, or lower rates of senior recruitment for women.
3. Analysis of PhD Job Placement Data,
2010-2015.
The Academic Placement Data and Analysis project (APDA), directed by Carolyn Dicey Jennings, maintains placement information for PhD graduates from English-language philosophy programs around the world, including name; area(s) of specialization (AOS); graduation year and program; and placement institution, type, and year. While the APDA database is likely the most complete record of placement information for the field of philosophy, it is more complete for the years 2010-2015 than for prior years. For this reason, the below analyses use data only for people known to have graduated between 2010 and 2015. In most cases, gender was determined using an online gender probability generator based on first name (genderize.io), using website photos only if probability was below .6. In 0.3% of cases (7/2361) gender was judged to be indeterminable or non-binary. Those cases were excluded from further analysis. Area of specialization was grouped using the same system described in section 2.[16]
In
this dataset, 29% of those with recorded academic placements were women (594/2044)
and 33% of those with permanent academic placements were women (374/1120). Both of tThese
proportions are both statistically higher than the
estimated proportion of women in faculty positions in the U.S., U.K, and Australia
(CI 27% to 31% and 31% to 36%, respectively; see footnote 2 for comparison).[17]
Since many graduating programs do not report area of specialization, we had to
leave subfield unclassified for 25% of the dataset (596/2354). Missing subfield
information was more common among graduates of unrated programs than among
graduates of rated programs: 32% vs. 22% (229/717 vs. 367/1637, z = 4.9, p <.001). It was also
more common among men than women: 27% vs. 22% (449/1674 vs. 147/680, z = 2.6, p
= .008). For those with classified subfields, area of specialization was
significantly different by gender, but not as strikingly so as among PGR
faculty (χ2 [3] = 8.7, p = .03). See Table 3.
Table 3: Percentage of graduates in each subfield who are women, among graduates in APDA database, 2010-2015.
Subfield # women # men % women
Value Theory 195 375 34%
Language, Epistemology, Mind, and Metaphysics 135 364 27%
History and Traditions 136 299 31%
Science, Logic, and Math 67 187 26%
We did not see evidence of gender differences based on the 2014 PGR rating of the PhD-granting university: the mean rating of the granting university was similar for women and men (3.1 and 3.2 respectively, t = -1.0, p = .31) as was the proportion of women from programs with no PGR rating and women from programs with a PGR rating (29% each).
Among PGR-rated programs and excluding those with unknown AOS, we saw a marginally statistically significant difference in the mean PGR rating of graduates from different subfields (LEMM highest; the other three areas similar), using the ANOVA test for comparing multiple means (F [3, 1266] = 2.5, p = .06).[18] More strikingly, graduates from unrated programs were less likely to specialize in Language, Epistemology, Mind, and Metaphysics (14% vs. 34%), less likely to specialize in Science, Logic, and Math (6% vs. 18%), and more likely to specialize in History and Traditions (44% vs. 17%) than were graduates from rated programs; but the rates of specialization in Value Theory were similar for unrated and rated institutions (36% vs. 31%; a statistically marginal difference at z = 1.8, p = .07).
Hypotheses 1 and 2 are thus supported: Gender disparities are large in this dataset, with women disproportionately specializing in Value Theory. Hypothesis 3 is not supported: The percentages of women do not appear to change at the highest levels of status. These data are consistent with, and perhaps support, Hypothesis 4: If 29% of recent PhD graduates with recorded academic placements are women, this might reflect a trend toward decreasing gender disparity, if women comprise fewer than 27% of existing faculty in the relevant range of hiring departments – though the unsystematic geographic mix of hiring departments makes a strict comparison impossible.
In this section and the last, we categorized philosophers according to the PhilPapers Categorization Project, focusing on the Value Theory subfield. In the following sections we focus on the subfield of Ethics (broadly construed to include applied ethics, normative ethics, meta-ethics, social and political philosophy, and law), excluding areas of specialization such as aesthetics and gender, race, and sexuality from our analyses. Given the small numbers of those working in the excluded areas of specialization (17 out of 268 Value Theorists in the PGR dataset, and 42 out of 570 Value Theorists in the APDA dataset), this difference in labeling should not have a large effect on our conclusions.
4. Survey of Earned Doctorates, 1973-2014.
The Survey of Earned Doctorates (SED) is a questionnaire distributed by the U.S. National Science Foundation to doctorate recipients at all accredited U.S. universities, drawing response rates over 90% annually. Relevant data are publicly available on the NSF website under “table 16” for the years 2009 to 2014. Upon request, the NSF supplied us with data going back to 1973. Available data include gender by subfield, with the relevant subfields being “philosophy” (1973-2014) and “ethics” (2012-2014). For analysis, we merged these two subfields.[19]
For 2009-2014, 29% of “philosophy” and “ethics” SED respondents who reported gender were women. This percentage matches the 29% of women among both PhD graduates as a whole and PhD graduates with some form of academic placement in a similar period in the Anglophone-dominated (but not exclusively U.S.) APDA dataset analyzed in Section 3. In the same period, women received 51% of PhD degrees in the humanities as a whole (16,330/31,734). However, philosophy was not entirely alone among the humanities in its gender disparity: “music theory and composition” was the most gender skewed of the 30 humanities categories with data for this six-year period, at 22% women (127/587). The third most skewed humanities discipline was “religion/religious studies, Jewish/Judaic studies”, at 34% women (646/1876).
Figure 1 shows historical trends back to 1973.[20] A linear regression predicting percentage of doctorates awarded to women by year of award is significantly different from zero slope (t = 8.6, p < .001) but the slope is still rather flat, with an increase of only 0.30% per year. Since we had hypothesized that change in disparity might be slowing, we also tried fitting a quadratic curve, displayed in black in Figure 1. The quadratic curve does indeed fit much better than the linear, with a difference of 11.40 in the AICc scores. (Akaike corrected [AICc] scores compare goodness of fit between curves of different shapes, penalizing models with more parameters to avoid “overfitting”.) The AICc relative likelihood of the quadratic vs. the linear is .996 to .004. In other words, the visually apparent flattening is highly unlikely to be chance variation in a linear trend. (Note: We use the quadratic only to test for flattening, not to extrapolate beyond the measurement years.) One intuitive way to see the slowing is to aggregate the data by decade: in 1973-1979 17% of U.S. philosophy PhDs went to women; in the 1980s, 22%; in the 1990s, 27%; in the 2000s, also 27%; and in 2010-2014, 28%.
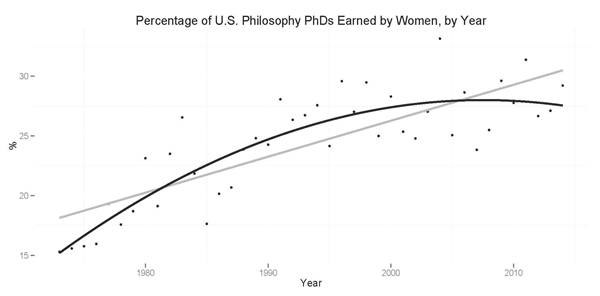
Figure 1: Based on SED data. The gray line is the best linear fit. The black line is the best quadratic fit.
These data confirm Hypothesis 1: Gender disparity in philosophy remains large. Hypothesis 4 is also confirmed: Disparity has decreased, but this decrease has slowed over time. For comparison, from 1990 to 2010 the percentage of women earning doctoral degrees in philosophy has increased at a rate of 0.2% per year, but the percentage of women earning doctoral degrees overall has increased at a rate more than three times this value, at 0.7% per year (see footnote 6).
5. American Philosophical Association
Gender Data.
The American Philosophical Association (APA) is the main professional association of philosophy professors in the United States (with substantial international involvement). In 2014 and 2015 it conducted demographic surveys of its members. In 2014, 4152 out of 9180 members responded with gender information (45% response rate).[21] Among those, 983 (24%) were women and 1 responded with “something else.” In 2015, 3362 out of 8975 members responded (37% response rate), 805 (24%) women, 4 “something else”, and 19 “prefer not to answer.” Although these numbers are similar to other estimates that support Hypothesis 1, reasons for caution include (a) that women may be more or less likely than men to be APA members or (b) that women may be more or less likely to respond to such a demographic survey.
6. Appearance on American Philosophical
Association Programs, 1955-2015.
Long-term temporal trends might also be evident from patterns of participation in meetings of the American Philosophical Association. By examining the roles women play in the program (e.g. invited speaker, commenter, session chair), we can also explore questions about prestige and visibility.
The APA contains three divisions: Eastern, Central (formerly Western), and Pacific, each of which meets separately, with participants from across the world. There is no primary meeting of the entire APA. Meetings consist of a “main program” organized by a program committee and a “group program” separately organized by subgroups of philosophers. Some of the main program sessions are “special sessions” on issues like the teaching of philosophy or on the status of women or racial and ethnic minorities. The remaining sessions are focused on research topics in philosophy. “Colloquium” sessions normally consist of submitted and refereed papers, often by less senior faculty. Some “symposium” sessions are similarly refereed, while others are invited. “Colloquium” sessions typically have only one commentator; “symposium” sessions have longer talks, sometimes with more than one commentator. Other sessions are invited, normally featuring senior, visible people in the profession. Some sessions are named, and typically regarded as especially prestigious, such as the “Dewey Lecture” or the “Presidential Address” (each division has its own President). Also notable are “Author Meets Critics” sessions, which feature a panel of invited critical treatments of a recent book and a reply by the author. Every session has a “chair”, which (despite the title) is a less visible and prestigious role than speaking or commenting, normally confined to keeping the session on schedule and managing the question queue.
We examined main session programs for all three divisions from five sample years: 1955, 1975, 1995, and 2014-2015, excluding special sessions.[22] The gender of every program participant was coded based on first name or personal knowledge, excluding cases judged to be ambiguous, such as where only first initial was provided, where the name was gender ambiguous (e.g. “Pat”), or names where gender associations were unknown to the coder (e.g. “Lijun”). Overall, 8% (240/3180) of the names were judged to have indeterminable gender, with a trend toward more indeterminability in the 2014-2015 data (10%: 177/1703; impressionistically, due to a higher rate of non-Anglophone names). We sorted program role into five categories in what we judged to be decreasing order of perceived prestige: (1) named lecture, author in author-meets-critics, or symposium speaker with at least one commentator dedicated specifically to her presentation; (2) non-colloquium speaker not in Category 1, including critic in author-meets-critics, (3) non-colloquium commentator, (4) colloquium speaker or commentator, (5) chair of any session. Finally, we classified each participant as ethics (construed broadly to include political and social philosophy, but not including other value theory fields, such as aesthetics), non-ethics, or mixed/excluded (including intermediate topics, such as philosophy of action, and historical figures, such as Kant, if the ethical focus was not made explicit). Thus, we could examine temporal trends in women’s involvement in APA programs, both in ethics and in non-ethics, and whether women are more or less likely to serve in prestigious roles on the program.
Figure 2 displays the data on women’s overall involvement in ethics and non-ethics sessions in the four time periods. As is evident from the figure, women’s involvement has increased substantially since 1955 and 1975. Overall, women were 6% of program participants in 1955 (7/121, excluding 5 indeterminable), 16% in 1975 (62/397, excl. 20), 25% in 1995 (220/896, excl. 38), and 32% in 2014-2015 (481/1526, excl. 177). By 2014-2015, 41% (206/500) of participants in ethics sessions were women. The increase in women was statistically significant both for ethics and non-ethics (correlating year 1955, etc., with gender = 1 for women and 0 for men yields rpb = .18 in ethics, rpb = .13 in non-ethics, with both p values < .001 [treating 2014 as 2015]).[23] The proportion of women in ethics roles was significantly higher than in non-ethics roles for 1995 and 2015 (1955 Fisher’s exact p = .09, two-tailed; 1975 z = -0.5, p = .65; 1995 and 2014-2015 z’s > 5.0, p’s < .001).
Figure 1: Based on APA data. The vertical lines indicate 95% confidence intervals.
Overall program role data are displayed in Table 4, with 1955 and 1975 merged for presentation. Chi-square analysis of 2014-2015 shows a statistically significant relationship between gender and program role (χ2 [4] = 18.9, p = .001). In 2014-2015, women were more likely to appear as invited speakers, but not in the highest prestige invitations, and as session chairs (Categories 2 and 5), than to appear in the highest prestige lectures and as colloquium speakers (Categories 1 and 4), but since this doesn’t map neatly onto our initial hypothesis about prestige, and since it is not consistent across the sampled years, we interpret the results cautiously.
Table 4: Percent of women in different program roles for APA meetings in sample years from 1955-2015.
Role 1955-1975 1995 2014-2015 _
Category 1 (most prestige) 5/34 (15%) 11/46 (24%) 27/99 (27%)
Category 2 4/63 (6%) 28/104 (27%) 117/314 (37%)
Category 3 8/61 (13%) 15/51 (29%) 29/96 (30%)
Category 4 38/256 (15%) 104/463 (22%) 155/597 (26%)
Category 5 (least prestige) 14/104 (13%) 62/232 (27%) 153/420 (36%)
These results compare interestingly with the results of other measures. Overall APA main program participation in 2014/2015 (excluding special sessions) was 32% women with a 95% confidence interval from 29% to 34%. If the proportion of women in the profession is 28% or less, as other data seem to show, then women are proportionately more likely to appear in APA main programs than are men. Several past APA program committee members have told us that they have made efforts to include more women on the program. These data suggest that their efforts may have been successful, perhaps especially in the invited parts of the program (all but Category 4, which at least in recent years tends to be anonymously refereed). Another possible explanation is greater interest in APA meetings among women than among men.
These data confirm Hypotheses 1 and 2 (gender disparity, but less in ethics), and provide mixed results regarding Hypothesis 3 (that disparity is largest at the highest levels of prestige). Hypothesis 4 is that women’s involvement has increased over time but only slowly in the past few decades. These data confirm women’s increased involvement, but the rate of increase has been slow: 0.4% per year, compared to an overall rate of increase in women earning doctoral degrees in the United States of 0.7% per year from 1949/1950 to 2009/2010.
7. Authorship in Five Elite Journals,
1954-2015.
To further examine temporal trends in visibility at the highest levels of prestige, we examined authorship rates over time in five elite journals. Three of the journals were Philosophical Review, Mind, and Journal of Philosophy, sometimes referred to as the “big three” general philosophy journals. All three have been regarded as leading journals since at least the early 20th century, and they tend to top informal polls of journal prestige, such as polls on the Leiter Reports blog, sometimes alongside relative newcomer Noûs (e.g. Leiter 2013, 2015). Since these journals publish proportionately less in ethics than in other areas of philosophy, we also include two elite ethics journals, Ethics and Philosophy & Public Affairs, which tend to top polls of ethics journals (e.g. Bradley 2005, Leiter 2009), although Philosophy & Public Affairs has only been publishing since 1972.
In December 2014, we examined the names of all authors publishing articles, commentaries, or responses (but not book reviews, editorial remarks, or retrospectives), in four time periods: 1954/1955, 1974/1975, 1994/1995, and 2014/2015. (However, since not all 2015 issues of Philosophical Review and Journal of Philosophy had been released at the time of data collection, we went back into late 2013 for these two journals to have a full two-year sample.) All articles in Ethics and Philosophy & Public Affairs were coded as “ethics.” Articles in the other three were coded as either “ethics” or “non-ethics” depending on article title or a brief skim of the article contents when the title was ambiguous. Gender was coded based on first name or personal knowledge, or in cases of uncertainty a brief web search for gender-identifying information such as a gender-typical photo or references to the person as “him” or “her” in discussions of that person’s work. In only 11 cases out of 1209 were we unable to make a determination. We treated non-first-authors in the same manner as first authors, but only 5% of the articles had more than one author.
Figure 3 displays the results. Increases in the rates of women authors were statistically significant, though small, both overall (rpb = .09, p = .001) and for ethics considered separately (rpb = .09, p = .04); for non-ethics the increase was marginally statistically (significant rpb = .07, p = .054). The proportion of women among ethics authors was significantly higher than among non-ethics authors in 1974/1975 and 1994/1995 (26/161 vs. 13/192, z = 2.8, p = .005; 21/119 vs. 11/127, z = 2.1, p = .04), but no statistical difference was evident in the earlier or later time samples (5/106 vs. 12/236, z = -0.1, p = .88; 18/120 vs. 14/137, z = 1.2, p = .25).
Figure 3: Error bars indicate 95% confidence intervals.
The 2013-2015 results are strikingly low. Merging the ethics and non-ethics for analysis (which probably somewhat overrepresents ethics compared to philosophy as a whole), only 12% of authors were women (32/257). This is significantly lower than even the more pessimistic estimates of the percentage of women in the profession, with a 95% confidence interval from 9% to 17%, and considerably lower than the percentage of women contributing to APA main programs, especially for ethics: In our most recent sample, only 15% of authors publishing on ethics in these elite journals were women, despite women constituting 41% of APA ethics session participants.
In this data set, little change is evident since the 1970s. Given the large error bars and the dangers of post-hoc analysis, we would interpret that fact cautiously. However, these low and flat numbers since the 1970s are consistent with data from 2002-2007 for these same journals, compiled by Sally Haslanger (2008); Haslanger found 12% women authors in a selection of eight elite journals, and 13% in the five journals we have analyzed.
These data confirm Hypothesis 1, that gender disparities in philosophy are high. They provide mixed evidence for Hypothesis 2, with significantly less disparity in ethics than in non-ethics for two of the four sampled time periods. They support Hypothesis 3: Authorship in one of these journals plausibly constitutes a higher level of visibility in mainstream Anglophone philosophy than does faculty membership (at least outside PGR-ranked departments), and at this high level of visibility the percentage of women is lower than that of the faculty as a whole. These data also support Hypothesis 4: Disparity has decreased since the 1950s, but only slowly if at all since the 1970s.
8. Most-Cited Authors in the Stanford
Encyclopedia of Philosophy.
The Stanford Encyclopedia of Philosophy (SEP) is widely viewed as the premier resource for up-to-date literature reviews in mainstream Anglophone philosophy. Our impression is that frequent citation in the SEP is a better measure of visibility in mainstream Anglophone philosophy than are more standard bibliometric measures, such as Web of Science and Google Scholar. We will present some confirmatory tests of our SEP measure below.
In summer 2014, we downloaded the bibliographical section of every main entry from the SEP (approximately 1400 encyclopedia entries, containing over 100,000 citations). Looking only at first-authorship, we examined authors who appeared at least once in the bibliographies of at least twenty separate entries, hand-separating authors with common names (e.g. “J. Cohen”), hand-merging individuals who used different names in different periods of their career (e.g. “Ruth Barcan” and “Ruth Marcus”), and excluding authors born before 1900. In this way we generated a ranked list of the 267 contemporary authors appearing as first author in the greatest number of SEP entries.[24] We call these the “most cited” authors in the SEP. We believe this list has surface plausibility as an approximate measure of visibility in mainstream Anglophone philosophy. (The top five were David Lewis, W.V.O. Quine, Hilary Putnam, Donald Davidson, and John Rawls.) Evidence in favor of its plausibility is that of the top ten names on this list, seven also make the top ten in a recent reputational poll of the “Most Important Anglophone philosophers, 1945-2000” (Leiter 2015a). Further, it fares well in contrast to other measures in targeting visibility among mainstream Anglophone philosophers. For example, a 2007 Thomson-Reuters ISI Web of Science list of authors of the most-cited books in the humanities lists philosophers most of whose influence has been in other humanities or outside of the mainstream Anglophone tradition.[25]
Women are underrepresented on this list, constituting only 10% of the total (27/267). We classified philosophers on this list as primarily known for their work in ethics (construed broadly to include political and social philosophy as well as history of ethics) or not primarily known for their work in ethics. Despite some close calls,[26] most classifications were clear. Although women were only 6% of the non-ethicists on this list (12/197), they were 21% of ethicists (15/70), a difference large enough to be statistically significant even in this relatively small sample (z = 3.7, p < .001; given the sample size and clear directional hypotheses, all proportion tests in this section are one-tailed to improve power).
Table 5: Women among the 267 most-cited contemporary authors in the Stanford Encyclopedia of Philosophy
Citation Rank ethicists non-ethicists
women men % women men %
Top Tier (1-89) 4 17 19% 1 67 1%
Middle Tier (90-178) 6 21 22% 3 59 5%
Bottom Tier (179-267) 5 17 23% 8 59 12%
Women constitute a smaller proportion of the top tier than of the bottom tier (6% vs. 15%, z = -2.0, p = .02), and notably only one woman appears among the top 50. We also noted the birth year, usually based on biographical information available on the web, and in a few cases estimated from other information such as year of BA, PhD, or first publication (estimating 22 years for BA and 29 years for PhD or first publication). The mean birth year for men was 1939, which is earlier than women’s mean birth year of 1945 (t = 2.4, p = .03; equal variances not assumed), suggesting that women are a bit better represented in the younger generation than in earlier generations.
These data support all four of our hypotheses. The percentage of women is small (Hypothesis 1); it is greater in ethics (Hypothesis 2); it is lower at the highest levels of visibility than at more moderate levels of visibility, both within these data and comparing these data with the prevalence of women in the profession as a whole (Hypothesis 3); and the disparity seems to be slightly less in the younger generation (Hypothesis 4).
9. Analysis of “he” and “she” in Selected Philosopher’s Index Abstracts, 1970-2015.
Another measure of visibility is the mention of one’s name in article abstracts in the Philosopher’s Index, the standard source of English-language philosophy abstracts since 1940 (though now facing competition from PhilPapers). Schwitzgebel (2010) defines this as “discussion” and analyzes the temporal course of the discussion rates of selected prominent philosophers, finding peak discussion typically around ages 55-70.
“Extended discussion” might be operationalized as reference at least twice in the abstract of an article, suggesting a very high level of attention. Outside of history of philosophy, such treatments are a small percentage of articles. The nominative pronoun might be especially telling, since its presence suggests that the person is being referred to repeatedly in independent clauses. For example:
Later, Nussbaum gradually reconsidered the notion of patriotism in texts that remained largely unknown and rarely discussed. This article begins with a brief account of her shift from cosmopolitanism to what she terms ‘a globally sensitive patriotism,’ and the task assigned to education within this framework....
This suggests a possible measure of the rates at which women receive this sort of discussion, compared to men: Compare the ratio of “she” to “he” in philosophy abstracts, then remove cases in which those words are used with generic intent (e.g. “If the agent wouldn’t have done otherwise whether or not she could have….”) or otherwise not referring to an individual philosopher whose work is being discussed (e.g. reference to historical leaders or third-person reference to the author him- or herself for abstracts written in the third person).
We searched the Philosopher’s Index for all appearances of “she” or “he” from 1970 to 2015 in a sample of ten ethics journals and ten general philosophy journals.[27] This yielded a total of 876 ethics journal abstracts and 1445 non-ethics abstracts. Limitation to abstracts in which “she” or “he” refers to an individual philosopher reduced the totals to 620 in ethics and 932 in non-ethics. An approximate total universe of abstracts was estimated by searching for “the” in abstract field, which yielded about 6700 hits in the ethics journals during this period and 11,600 in the non-ethics journals – thus only about 9% of ethics abstracts and 8% of non-ethics abstracts met the criterion for containing extended discussion of an individual philosopher. Being mentioned multiple times in the abstract of a journal article is a high and unusual level of attention in mainstream Anglophone philosophy.
Gender trends by decade are displayed in Table 4. Consistent with the data from the Stanford Encyclopedia of Philosophy, at this high level of visibility the gender skew is very large, especially in non-ethics and especially for older articles. In the ten selected non-ethics journals, from the 1970s through the 1980s, 266 abstracts contained extended discussion of the work of men and only 4 contained extended discussion of the work of women. The numbers do appear to increase over time, more clearly so in the non-ethics journals. Merging the data from the 2010s, which might somewhat overrepresent ethics relative to the profession as a whole, only 13% of the recipients of extended discussion were women. Merging across the decades, women received extended discussion more frequently in the ethics abstracts than in the non-ethics abstracts (z = 3.3, p = .001).
Table 6: Use of “she” or “he” to refer to individual philosophers in the abstracts of 10 selected ethics journals and 10 selected non-ethics journals, 1970-2015.
Decade Ethics Non-Ethics
# she _ # he % she # she # he % she
1970s 8 84 9% 4 129 3%
1980s 3 74 4% 0 137 0%
1990s 20 127 14% 9 180 5%
2000s 16 168 9% 16 213 7%
2010s 19 101 16% 27 217 11%
Given that the philosophical canon was overwhelmingly male before the 20th century, we conducted a second analysis removing pronouns referring to philosophers whose primary work was done before 1900. (Frege, an important borderline case, was classified as pre-20th century.) This resulted in the removal of 364 abstracts (23% of the total) and did not have a large effect on the results, with 20th-21st century women receiving 7% of extended discussion in the 1970s (12/161) and still only 14% in the 2010s (44/305). The 95% confidence interval around this last number is 11%-19%, significantly lower than the percentage of the women currently in the profession, but perhaps not lower than the percentage several decades ago (see footnote 20). This data set supports Hypotheses 1, 2, and 4: There’s a substantial gender disparity in targets of extended philosophical discussion, less so in ethics, and with a slow increase in the proportion of women over time. Hypothesis 3 is that the disparity is more severe at the highest levels of visibility than at more moderate levels of visibility. Whether this hypothesis receives support is harder to assess, since philosophers are sometimes targeted for extended discussion decades after their relevant work, so one might expect discussion percentages to reflect a compromise between the percentage of currently active women and percentages from a few decades previously.
10. Conclusion.
We began with four hypotheses.
Hypothesis 1 was that gender disparity remains large in mainstream Anglophone philosophy. This hypothesis was strongly supported. Women constituted 25% of U.S. PGR-ranked faculty, 29% of recently placed PhDs, 29% of recent philosophy PhDs in the U.S., 24% of APA members who reported their gender, 32% of recent APA program participants, 12% of recent authors in five elite journals, 10% of the most-cited contemporary authors in the Stanford Encyclopedia of Philosophy, and 14% of 20th-21st century philosophers recently receiving extended discussion in the abstracts of 20 sampled journals. Only one measure approached gender parity: women were 41% of participants in APA ethics sessions in 2014-2015.
Hypothesis 2 was that ethics, construed broadly to include social and political philosophy, is closer to gender parity than are other areas of philosophy. This hypothesis was also strongly supported. The proportion of women in ethics substantially exceeded the proportion in other areas of philosophy among U.S. PGR-ranked faculty, recent job placements, APA program participants, authorship in elite journals, highly cited authors, and targets of extended journal article discussion. Although the difference is not statistically significant for every time sample in every measure, across the board it is a consistent story. Despite the fact that ethics is closer to parity than other areas of philosophy, by no measure did it achieve parity and by most measures it remains very far from parity.
Hypothesis 3 was that at the highest levels of visibility or prestige within mainstream Anglophone philosophy, gender disparity is even more pronounced that at more moderate levels of visibility or prestige. Evidence for this hypothesis was mixed. Contra Hypothesis 3, the percentage of women faculty at PGR-ranked PhD departments was similar to the percentage in the discipline as a whole, and the percentage among the top-12 ranked programs was also similar. Also contra Hypothesis 3, recently placed women did not tend to receive their degrees from lower-ranked institutions than their male counterparts; nor were women disproportionately likely to have less prestigious roles on the APA program. However, consistent with Hypothesis 3, women were considerably less likely to have full professor rank in PGR-ranked PhD departments than assistant or associate rank, were a disproportionately small percentage of authors in elite journals (12%), were a disproportionately small percentage of most-cited SEP authors (10%), and perhaps were a disproportionately small percentage of authors recently receiving extended discussion in journal abstracts (14%).
Hypothesis 4 divides into two sub-hypotheses: 4a, that women’s involvement and visibility has increased over time, and 4b, that increase has been slow in the past few decades. Hypothesis 4a received strong support and Hypothesis 4b received support. The PGR data perhaps support 4a if the presence of more women at the assistant and associate professor level than at the full professor level is interpreted as indicating youth rather than slower rates of promotion. (It might well reflect both.) The APA data support 4a and 4b: Women’s participation in APA programs has increased substantially in the past few decades, but the rate of increase is slower than the rate of increase in women earning doctoral degrees in the United States. Elite journal authorship data support both 4a and 4b: Despite an increase since the 1950s, rates of authorship appear to have flattened in the low teens since the 1970s. Rates of extended discussion have likewise risen, but slowly at best in ethics. Also supporting hypothesis 4a is the somewhat younger mean birth year of women than men among authors most cited in the SEP. Perhaps the clearest evidence for both 4a and 4b is the data from the Survey of Earned Doctorates: The best-fitting quadratic curve shows a substantial increase of the percentage of philosophy PhDs awarded to women, from 17% in the 1970s to 22% 1980s, but then flattening out to 27-28% from the 1990s to the present.
We leave speculation on causes and possible remedies for another occasion. However we emphasize four features of our findings that might be especially relevant to policy:
A. Journal editors and conference organizers in ethics should not assume that a proportion of women consistent with the proportion in philosophy as a whole (say, in the low 20%’s) is representative of the proportion of available philosophers in ethics.
B. Although the gender disparity in philosophy is large, it is even larger outside of ethics than it is in ethics. Non-ethics fields might be in even more need of intervention than would appear to be the case looking at the numbers in philosophy as whole.
C. Although the younger generation appears to be closer to gender parity and ethics is somewhat closer to gender parity than other subfields, ethics remains far from gender parity in junior hiring; and it remains the case that the vast majority of authors of ethics articles in elite Anglophone journals are men.
D. If it is true that the 20th-century trend toward less gender disparity has slowed or stopped, then current practices to encourage gender parity might not be enough to ensure further progress toward that aim, and more assertive action might be required.[28]
Appendix:
Raw data are available online at http://faculty.ucr.edu/~eschwitz/SchwitzAbs/WomenInPhil.htm
References:
Alcoff, Linda (2011). A call for climate change. APA Newsletter on Feminism and Philosophy 11 (1): 7-9.
Australian Government, Department of Education and Training (2015). Table 2.6 Number of Full-time and Fractional Full-time Staff by State, Higher Education Institution, Current Duties and Gender, 2014. Selected Higher Education Statistics-2014 Staff Data, 2014 Staff Numbers
Beebee, Helen, and Jenny Saul (2011). Women in philosophy in the UK. British Philosophical Association: Society for Women in Philosophy in the UK.
Bradley, Ben (2005). Ethics journals. Blog post at PEA Soup (Oct. 4) [reporting a survey results originally by Brian Weatherson]. URL: http://peasoup.typepad.com/peasoup/2005/10/ethics_journals.html
Cameron, Elissa Z., Angela M. White, and Meeghan E. Gray (2016). Solving the productivity and impact puzzle: Do men outperform women or are metrics biased? BioScience advance: http://m.bioscience.oxfordjournals.org/content/early/2016/01/05/biosci.biv173.full.pdf
Cohen, Philip N. (2011). Gender segregated sociology. Blogpost at Family Inequality (Jun. 10). URL: https://familyinequality.wordpress.com/2011/06/10/gender-segregated-sociology/
Goddard, Eliza (2008). Improving the participation of women in the philosophy profession. Australasian Association of Philosophy: Committee of Senior Academics Addressing the Status of Women in the Philosophy Profession. Available at: http://www.aap.org.au/Resources/Documents/publications/IPWPP/IPWPP_ReportA_Staff.pdf
Grove, Jack (2013). Global gender index, 2013. Times Higher Education. Feature article May 2. URL: https://www.timeshighereducation.com/features/global-gender-index-2013/2003517.article
Haslanger, Sally (2008). Changing the ideology and culture of philosophy: Not by reason (alone). Hypatia 23: 210-223.
Healy, Kieran (2013). Lewis and the women. Blog post at Kieran Healy blog (June 19, updated Jun 26). URL: http://kieranhealy.org/blog/archives/2013/06/19/lewis-and-the-women/
Hirshfield, Laura E. (2010). “She won’t make me feel dumb”: Identity threat in a male-dominated discipline. International Journal of Gender, Science, and Technology 2 (1). Available at: http://genderandset.open.ac.uk/index.php/genderandset/article/view/60
Jennings, Carolyn Dicey, Patrice Cobb, and David W. Vinson
(2016). Academic Placement Data and
Analysis: An Update update with
a fFocus
on Gendergender. Blog spot post at Blog of the APA (May 3). URL:
http://blog.apaonline.org/2016/05/03/academic-placement-data-and-analysis-an-update-with-a-focus-on-gender/
Larivière Vincent, Chaoqun Ni, Yves Gingras, Blaise Cronin, and Cassidy R. Sugimoto (2013). Global gender disparities in science. Nature 504: 211-213.
Leiter, Brian (2009). Which journals publish the best work in moral and political philosophy? Blog post at Leiter Reports (Mar. 15). URL: http://leiterreports.typepad.com/blog/2009/03/which-journals-publish-the-best-work-in-moral-and-political-philosophy.html Poll results at: http://www.cs.cornell.edu/w8/~andru/cgi-perl/civs/results.pl?id=E_c5f31eca64119ba9
Leiter, Brian (2013). Top philosophy journals without regard to area. Blog post at Leiter Reports (Jul. 6). URL: http://leiterreports.typepad.com/blog/2013/07/top-philosophy-journals-without-regard-to-area.html
Leiter, Brian (2015a). Most important Anglophone philosophers, 1945-2000: The top 20. Blog post at Leiter Reports (Jan. 29). URL: http://leiterreports.typepad.com/blog/2015/01/most-important-anglophone-philosophers-1945-2000-the-top-20.html
Leiter, Brain (2015b). The top 20 “general” philosophy journals, 2015. Blog post at Leiter Reports (Sep. 28). URL: http://leiterreports.typepad.com/blog/2015/09/the-top-20-general-philosophy-journals-2015.html
Morley, Louise, and Barbara Crossouard (2014). Women in higher education leadership in South Asia: Rejection, refusal, reluctance, revisioning. University of Sussex: Centre for Higher Education & Equity Research. Available at: https://www.britishcouncil.org/sites/default/files/morley_crossouard_final_report_22_dec2014.pdf
National Center for Education Statistics (2015). Table 315.20. Available at: http://nces.ed.gov/programs/digest/d14/tables/dt14_315.20.asp
Norlock, Kathryn J. (2006/2011). Women in the profession: A more formal report to the CSW. Updated 2011. Available at: http://www.apaonlinecsw.org/data-on-women-in-philosophy
Paxton, Molly, Carrie Figdor, and Valerie Tiberius (2012). Quantifying the gender gap: An empirical study of the underrepresentation of women in philosophy. Hypatia 27: 949-957.
Pion, Georgine M., Martha T. Mednick, et al. (1996). The shifting gender composition of psychology: Trends and implications for the discipline. American Psychologist 51: 509-528.
Schwitzgebel, Eric (2010). Discussion arcs. Blog post at The Splintered Mind (Apr. 27). URL: http://schwitzsplinters.blogspot.com/2010/04/discussion-arcs.html
Schwitzgebel, Eric (2012). Women’s roles in APA meetings. Blog post at The Splintered Mind (Mar. 15). URL: http://schwitzsplinters.blogspot.com/2012/03/womens-roles-in-apa-meetings.html
Schwitzgebel, Eric (2014a). Citation of women and minorities in the Stanford Encyclopedia of Philosophy. Blog post at The Splintered Mind (Aug. 7). URL: http://schwitzsplinters.blogspot.com/2014/08/citation-of-women-and-ethnic-minorities.html
Schwitzgebel, Eric (2014b). The 267 most-cited authors in the Stanford Encyclopedia of Philosophy. Blog post at The Splintered Mind: Underblog (Aug. 7). URL: http://schwitzsplintersunderblog.blogspot.com/2014/08/the-266-most-cited-contemporary-authors.html
Schwitzgebel, Eric (2015). Percentages of women on the program at the Pacific APA. Blogpost at The Splintered Mind (Mar. 31). URL: http://schwitzsplinters.blogspot.com/2015/03/proportions-of-women-on-program-of.html
Schwitzgebel, Eric (2016). Changes in the race and gender of U.S. philosophy faculty, 1988-2004. Blogpost at The Splintered Mind (Mar. 14). URL: http://schwitzsplinters.blogspot.com/2016/03/changes-in-race-and-gender-of-us.html
White, Susan, Raymond Chu, and Roman Czujko (2014). The 2012-13 Survey of Humanities Departments at Four-Year Institutions. College Park, MD: Statistical Research Center, American Institute for Physics.